Having students create infographics supports the skills identified in Bloom's Taxonomy and can be used to develop and assess the abilities of MCNY students:
- Ability 2 - to communicate effectively through reading, writing, listening, speaking and other modes of expression.
- Ability 3 -To develop an appreciation of art and aesthetic awareness.
- Ability 6 - to describe social, natural and technological systems, using methods specific to the humanities and the social and natural sciences.
- Ability 8: - to use mathematical reasoning to analyze the world.
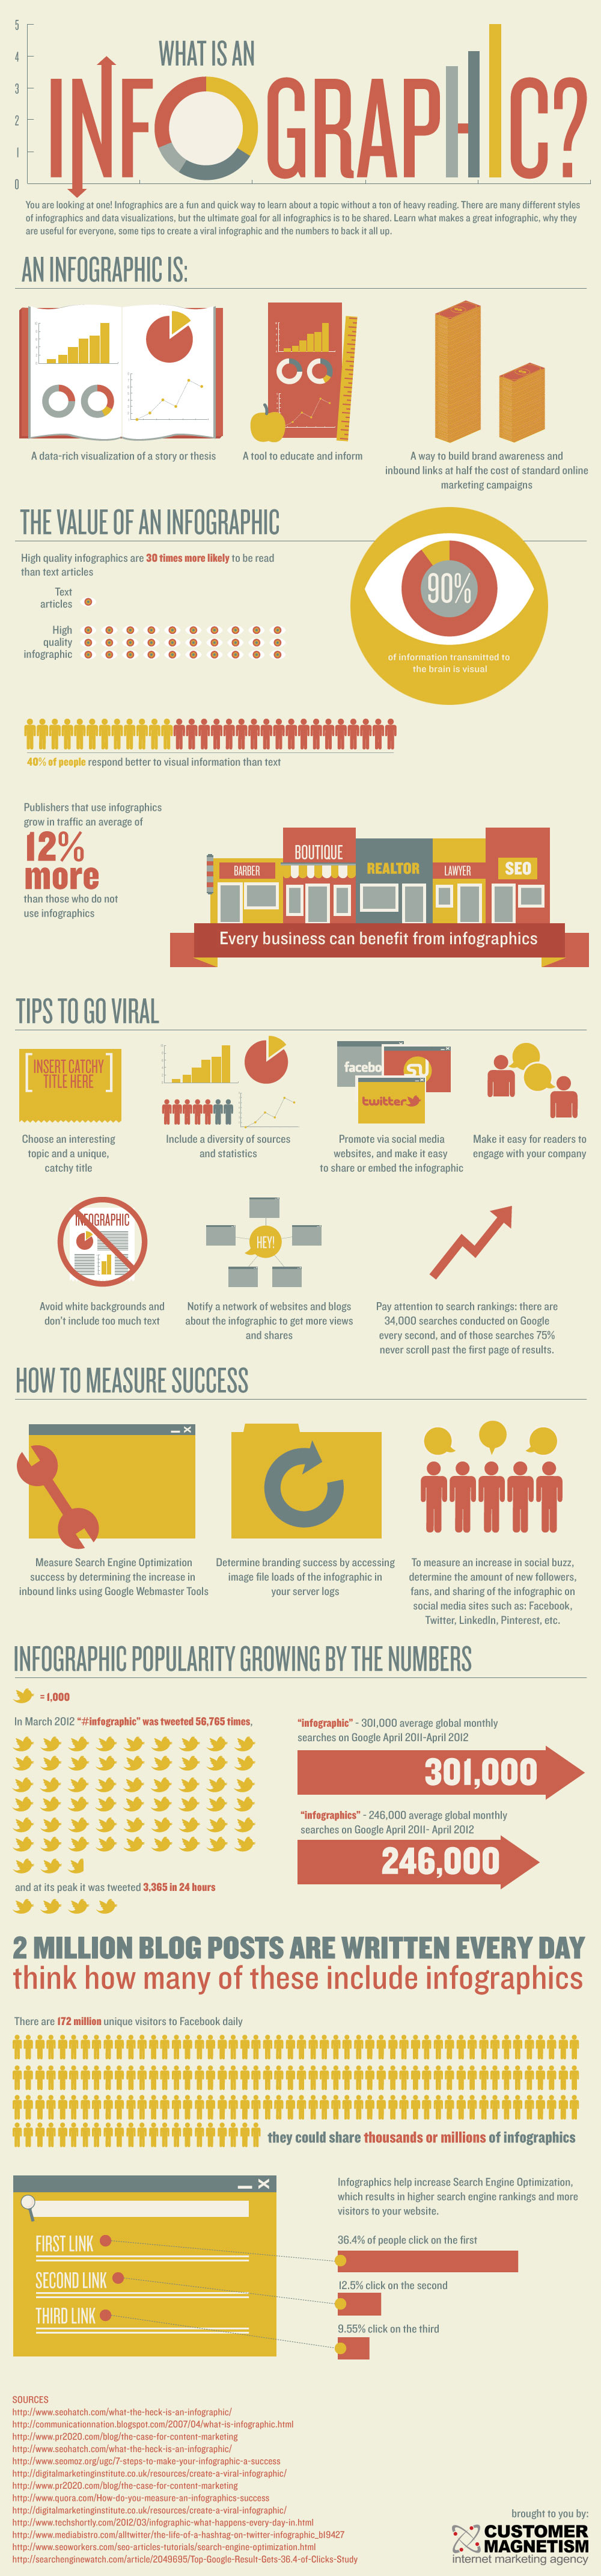 Created by Customer Magnetism.
You might begin with using infographics to display information to students (check out the Daily Infographic or the New York Times for infographics you might use in class).
An assignment that has the students design their own infographics and present them in class (in-person or online) can help develop analytical, communication, technological and visualization skills. Projects can be created by individuals or groups and can be an interactive component in a hybrid or web enhanced course. For example you might ask students to develop an infographic on a social problem, the history of their agency or to display their research findings in their CA. These can be presented in class or posted online for discussion.
Check out Vennage a free resource for making infographics, which I have used for student assignments and have gotten outstanding results.
You fight find the following resources useful:
- Woo (2015) - How to Make an Infographic in 5 Steps
- McGuire (2016) - Can You Change the World with Infographics?
- Creerson (2016) - Why You Should Use Infographics in Your eLearning Course
